
Space Weather Scenario Toolkit
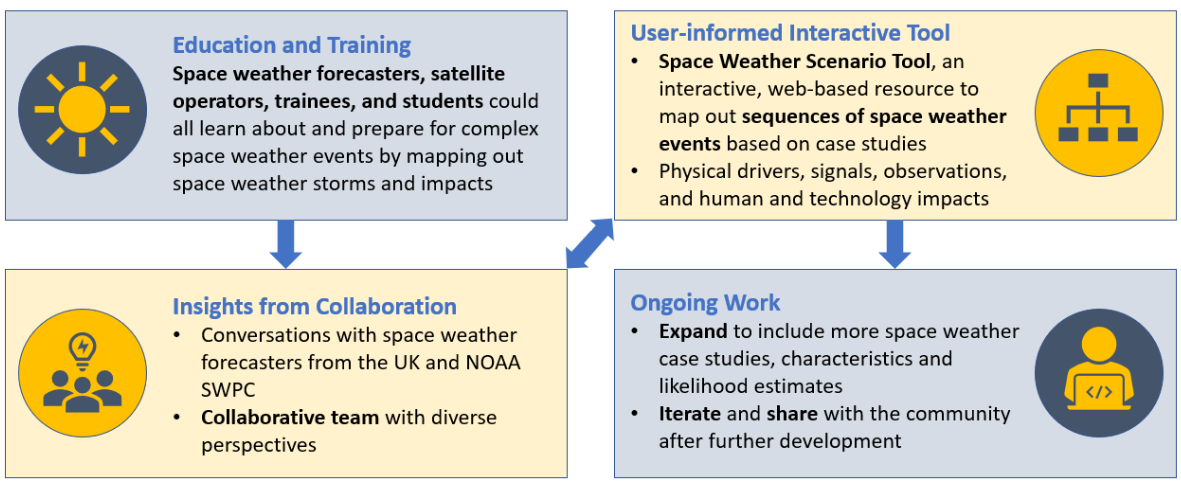
The Space Weather Scenario Toolkit is an interactive, web-based tool designed to allow users to explore sequences of space weather events, from physical drivers to technology and human impacts.
Space weather forecasters, satellite operators, trainees and students could all benefit from an interactive tool designed to map out space weather storms and impacts. We are developing a Space Weather Scenario Toolkit, a web-based resource for users to map out sequences of space weather events. The toolkit draws connections between space weather storms and the different engineering problems they can cause. The educational and practical tool distinguishes between physical drivers of space weather, intermediate observations and signals, and human/technology impacts. Prior and ongoing conversations with space weather forecasters from the United Kingdom and the NOAA Space Weather Prediction Center (SWPC) have deeply informed the direction of the toolkit development based on the practical needs of forecasters. As such, this work contributes to space weather research-to-operations, visualization, and educational goals.
Thus far, one major space weather active period has been reviewed to populate the majority of the events and impacts included in the interactive tool: the storms of December, 2006. To help piece together these complex space weather case studies, we develop detailed timelines of physical stormtime events and observed impacts based on extensive literature reviews. An example timeline of space-based and ground-based impacts from the December, 2006 active period is included below.
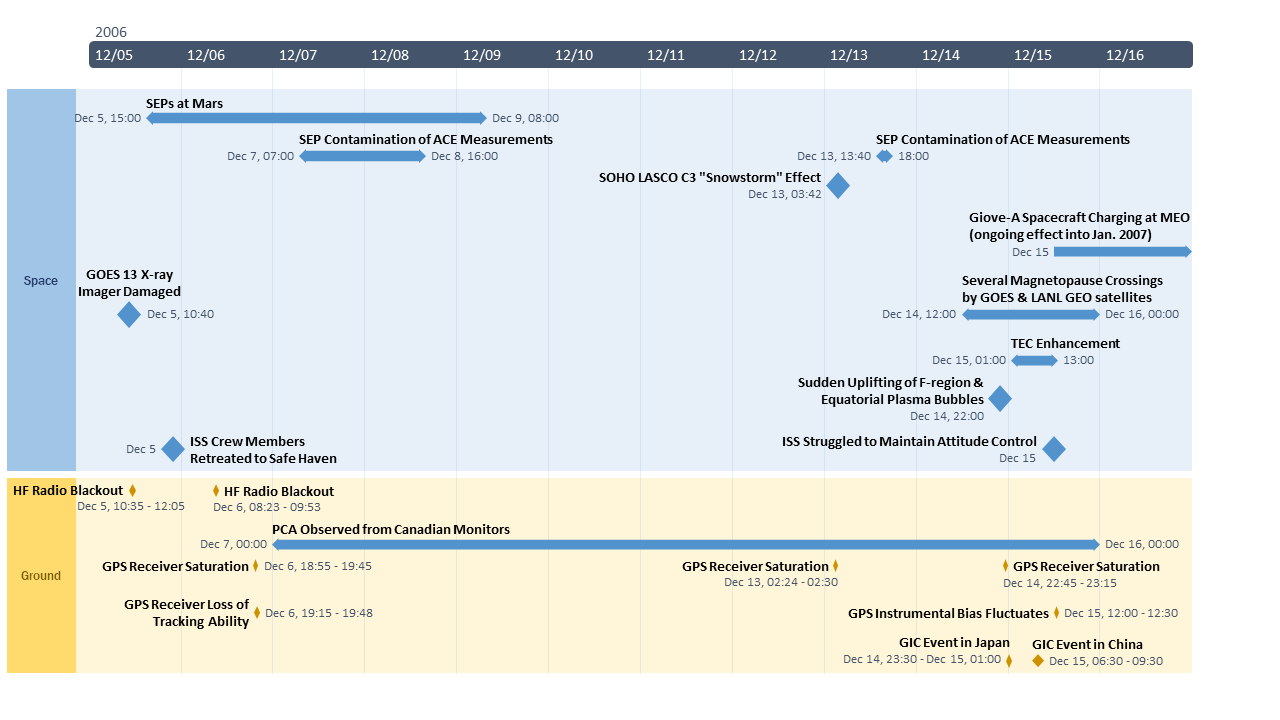
Check out our open-access journal article on space weather timeline development in support of this project, Timelines as a Tool for Learning about Space Weather Storms. Additional space weather event case studies we are working on untangling now include January, 1938 and September, 2017.
The tool is designed using D3 JavaScript as an interactive tree map, which users can click through to trace different space weather sequences of events from space weather activity origins to potential communication, hardware, and human impacts. We are working on including characteristics of the events, like duration and intensity, as well as general information about the likelihood of the possible effects produced.
Check out the video and poster presentations on this work below, presented at the virtual 2021 Space Weather Workshop.
Stay tuned for the publicly available version of this tool, soon to be released as a forkable Observable Notebook!
You can find all of the publications and presentations associated with this project under the References tab of this ResearchGate Project Page.